The necessity to conduct hydrological studies for water resources management, infrastructure design and, ecosystems protection can help mitigate flood and drought hazards. Prediction of low flows remains an important task for water management and ecosystems protection that can affect streams during low-flow periods. There have been many approaches to low flow prediction applying either statistical or deterministic methods, but there has not been any successful approach to link low flows between similar watersheds yet. The Fenton, Natchaug and Mount Hope Rivers watersheds are neighbors and are the major streams that discharge into the Mansfield Hollow Lake that belongs to the Thames River watershed, located in Northeast of the State of Connecticut in USA. A study to determine whether and how water withdrawals from the University’s Fenton River water supply wells affect the fisheries habitat of the Fenton River adjacent to the well field was conducted for four years at the beginning of 2002. The Mount Hope River was the only river with a long record of daily discharges available since the year 1940, meanwhile the Fenton and Natchaug River remained ungagged until the year 2006.
This research developed and tested two mathematical models for the prediction of minimum discharges in the Fenton and Natchaug Rivers with the discharges available from the Mount Hope River. Yearly Low Flow Duration Curves (LFFC) and Weibull distribution methods were applied to the three rivers to predict the low flows in the Fenton and Natchaug Rivers taking as input the minimum flows and dates in the Mount Hope River. The results found that the Weibull distribution model showed a much better accuracy than the Low Flow Duration Curve method for the prediction of low flows discharges in the Fenton and Natchaug Rivers.
Keywords: LFFC, Weibull, Correlation, Ungagged, Low flow, Prediction
Hydrological studies are useful in designing, planning, and managing water resources, infrastructure, and ecosystems.1 and, real-time flood forecasting and the construction of large structures can help mitigate flood and drought hazards and minimise their related losses, but the danger of these natural hazards due to their very extreme probability of occurrence cannot be completely avoided, and water engineers often face major challenges in estimating the frequency of these rare events for a site or region,1 besides that periods of low flow may be critical for the implementation of a sustainable water resources management, for meeting demands for often competing resources and many factors can impact for a low flow period.2
Bloschl3 suggest that accurate estimates of stream runoff and other hydrologic quantities are needed for numerous purposes of water resources, planning and management, in particular if one is interested in the spatial dimension. The most accurate way of obtaining such estimates at any one location is to measure them for an extended period of time. However, often this is not possible for financial or logistic reasons, or simply because one is interested in the future evolution of the hydrological variables. The alternative therefore is to estimate them from measurements at other locations in the region and transfer them, in some way, by modelling methods.3
The Fenton, Mount Hope River and Natchaug Rivers Watershed, are part of the Thames River watershed,4 these are the three major streams that discharge into the Mansfield Hollow Lake located in Northeast of the State of Connecticut in USA, where there is a recreational facility managed by the United States Army Corps of Engineers.5 The Fenton River has the characteristic morphology of the New England Rivers and, has a few tributaries along the stream such as Fishers brook, Roberts brook and other unnamed tributaries, resulting in rapid changes in flow and temperature in the river.6
During low flow periods, mainly in the summer, there are problems for the fish and wildlife in the Fenton River originating in the water necessities of the University of Connecticut (UConn) due to the fact that UConn pumps water from different places along the Fenton River; this water pumped has an impact directly on the stream flow of the Fenton River, creating unfavorable low flows and high temperatures for the fish and wildlife along the river.6
The Fenton River Project from 2002 to 2006, was created to know accurately the water balance in the Fenton River, the stream flow variations, especially in the low flow period of the summer along the Fenton River.6 Before that, Rahn4 conducted a research based in the same problems related with the effects of water withdrawals from the UConn wellfield on the flow in the Fenton River. Pump tests conducted using UConn’s water supply during an exceptionally low flow period in August 1966 resulted in the loss of surface water flow in the Fenton River in the well field area and for approximately 800 meters downstream6 and, were documented by Giddings7 in a UConn Master’s thesis. Also, there has to be taking in consideration that besides the low flow problems, there have been no continuous monitoring stream gauges located on the Fenton River, prior to the UConn study. During this study, stream flow discharges were measured in the field using ADCP during summer season from 2003 to 2005 then, the USGS has been taking measurements of discharges at Old Turnpike Bridge since October 2006.8 The United States Geologic Survey (USGS) maintains a continuous stream gauge on the Mount Hope River at Warrenville since 1940.9 and the Natchaug River at Marcy rd. near the town of Chaplin since 200610 which are accessible on a real-time basis.
Langat et al.1 considered that one major problem faced by water engineers is the determination of the most suitable form of an extreme value model, the underlying probability distribution of the flood, and the approximation of parameters of the distribution.
Mean and minimum streamflow flood frequencies are important for understanding the hydrological drought, monitoring the environmental flows, irrigation, and agriculture, and managing ecosystems and natural resources.1 The frequency analysis of low flows is used to determine whether an irrigation scheme needs storage or not, and for planning and designing such storage if required. However, low-flow frequency analysis has not received as much attention as maximum flows in recent years.1
Probability distribution models are applied in extreme flood analysis, drought investigations, reservoir volumes studies, and time-series modelling, among other various hydrological studies. However, the selection of the most suitable probability distribution and associated parameter estimation procedure, as a fundamental step in flood frequency analysis, has remained the most difficult task for many researchers and water practitioners.1
Langat et al.1 arrived to the conclusion in the The Tana River research, that the Weibull, GEV, and Gumbel functions were the best-fit functions for the prediction of annual minimum flows.1 Another way of showing the variation of flow is by a Low Flow Frequency Curve (LFFC) in which the discharge (usually average daily) in cubic meters per second (cms) is plotted against the exceedance probability, that means, the percent of time that a particular discharge is equalled or exceeded, the usual way to construct an LFFC is to use all of the daily flows over the entire period of record.6
Taking in consideration thee Fenton River lack of stream flow measurements during the twenty century, the availability of daily stream flow measurement during a long period of time in the neighbors watersheds, under this hypothesis two methods were developed applying a Low Flow Frequency Curves and Weibull distribution in the Mount Hope River from 1940 to 2019 to estimate minimum flows in the Fenton and Natchaug Rivers from 2006 to 2019. The results of the simulated discharges were compared with observed data from 2006 to 2019 applying coefficient of correlation and the Nash – Sutcliffe model.
Characteristics of the watersheds
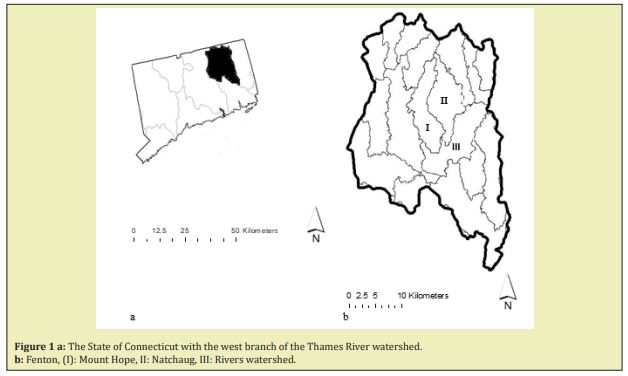
The Fenton River has a total length of 23km and drainage area of 89km2,6 as it enters Mansfield Hollow Lake and has since October of 2006 a gagging station for the estimation of daily stream flow discharges located at the bridge of Old Turnpike Road, USGS gage #01121330, Tolland County, Latitude 41°49'59.50", Longitude 72°14'34.01" NAD83.8 The Mount Hope River has a total length of 23km and a drainage area of 74.1km2 at the USGS gage #01121000, located at Warrenville, Latitude 41°50'37", Longitude 72°10'10" NAD27.9 The Natchaug River has a total length of 17km and a drainage area of 172.2km2 at the USGS gage # 01120790, located at Windham County, Latitude 41°48'58.21", Longitude 72°06'22.21" NAD83.10 Figure 1, summarized the location of the Fenton, Natchaug, Mont Hope and Thames Rivers watersheds inside the State of Connecticut, USA.
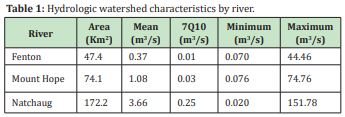
The Fenton River has a recorded mean discharge of 0.37, minimum of 0.070 and maximum of 1.61m3/s respectively.8 The Mount Hope River has a recorded mean discharge of 1.08, minimum 0.071 and maximum of 6.91m3/s respectively.9 The Natchaug River has a recorded mean discharge of 3.40, minimum of 0.71 and a maximum of 16.17m3/s respectively.10 Ahearn11 estimate the 7Q10 (the lowest 7-day average flow that occurs on average once every 10 years) for the Fenton, Mount Hope and Natchaug Rivers in 0.01, 0.03 and 0.25m3/s respectively. Table 1 summarized the hydrological watershed characteristics.
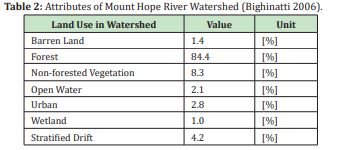
From Table 1, it is possible to deduce that Fenton and Natchaug watersheds surface area are 0.64 and 2.63 times bigger than Mount Hope watershed and the average flow in the Fenton River is 0.34 of the Mount Hope and in the Natchaug 3.4 times bigger. Minimum flow is very much alike in the Fenton and the Mount Hope Rivers, but Natchaug River has a minimum flow almost 10 bigger than Fenton River. Table 2 shows the vegetative cover of the Mount Hope River watershed, percentages of land use and the stratified drift, calculated by Bighinatti.
Low-Flow Frequency Curves (LFFC)
For the Environmental Protection Agency (EPA) low flow is the "flow of water in a stream during prolonged dry weather," according to the World Meteorological Organization.12 For this study, it was considered low-flow, the annual minimum daily flow for every watershed.
The Fenton, Mount Hope and Natchaug watersheds are very close each other; therefore they have a strong relationship.6 Searcy13 presents methods for estimating a long-term LFFC at a site that uses either a short-term, continuous flow record or spot base flow measurements.6 Both methods use an “index” station, e.g. Mount Hope, to establish the LFFC at the short-term station, e.g. the Fenton River. Both stations should be on unregulated streams with no significant changes to the watershed over the period of record used. Searcy13 suggest additional recommendations:
- The two gauging stations should be within 80.46 kilometers of each other.
- The two gauging stations should have the same likelihood of receiving rain. They do not necessarily need to have concurrent rains.
- A station on the same stream as the short-term station is usually a better index-station than one in another watershed.
- The index station and the short-term station must have enough concurrent records to establish a useable relation.6 Use of a short-term continuous record has the advantage of correlating flows over a larger range which then can used to develop a synthetic hydrograph that includes high flows.6
Smakhtin14 suggest that unlike the LFFC, which shows the proportion of time during which a flow is exceeded, a Low-flow Frequency Curve (LFFC) shows the proportion of years when a flow is exceeded (or equivalently the average interval in years (‘return period’ or ‘recurrence interval’) that the river falls below a given discharge). LFFC is normally constructed on the basis of a series of annual flow minima (daily or monthly minimum discharges or flow volumes), which are extracted from the available original continuous flow series, one value from every year of record.14 Figure 3, shows the schematic of the Patching model approach.15
Weibull distribution
For Helsel and Hirsch16 the Weibull formula has long been used by hydrologists in the United States for plotting flow duration and flood-frequency curves reference for determining flood frequencies in the United States (Interagency Advisory Committee on Water Data). The Blom formula is best for comparing data quantiles to those of a normal distribution in probability plots, though all of the above formulas except the Weibull are acceptable for that purpose. It is used in Bulletin 17B, the standard.17
The Weibull Probability distribution function F(x) by equation 1,1
F(x) = 1- e –(x/α)β (1)
Where:
α: Parameter
β: Parameter
x: Variable
α, β and t > 0
The random variable 𝑋 has an inverse Weibull distribution if its cumulative distribution function (cdf) takes the form I(p), Equation 2:
I(p) = α.(-Ln(1-p))(1/β) (2)
Where:
p: Probability
Nash - Sutcliffe model
The simulated and observed discharges were compared using the Nash - Sutcliffe model of efficiency (Nash and Sutcliffe, 1970) given by Equation 3 and a linear regression.
(3)
Where:
Oi |
Observed flows |
|
Mean of observed flows |
Si |
Simulated flows |
n |
Number of steps modeled |
Nash–Sutcliffe (1970) efficiency can range from −∞ to 1. An efficiency of 1 (NSE=1) corresponds to a perfect match of modeled discharge to the observed data. An efficiency of 0 (NSE=0) indicates that the model predictions are as accurate as the mean of the observed data, whereas an efficiency less than zero (NSE<0) occurs when the observed mean is a better predictor than the model or, in other words, when the residual variance (described by the numerator in the expression above), is larger than the data variance (described by the denominator). Essentially, the closer the model efficiency is to 1, the more accurate the model is. Threshold values to indicate a model of sufficient quality have been suggested between 0.5<NSE<0.65.18
Fenton, Mount Hope and Natchaug Rivers daily and annual minimum flows relationship
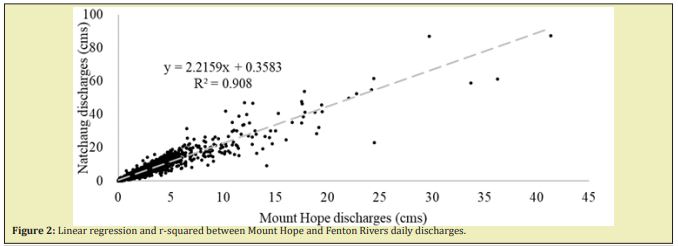
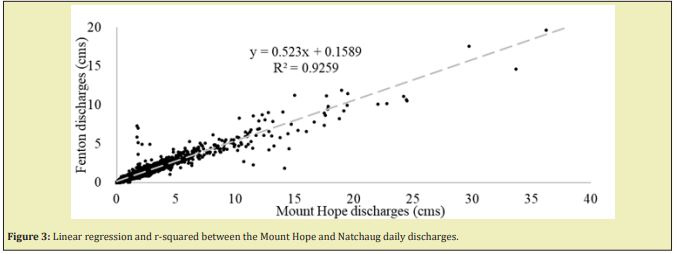
Figures 2&3 shows the linear regression and the r-squared, between the daily discharges of the Mount Hope with the Fenton and Natchaug Rivers from 10/01/2006 to 11/30/2019.
Figures 4&5 shows the linear regression and the r- squared, between annual minimum discharges of the Mount Hope with the Fenton and Natchaug Rivers from 10/01/2006 to 11/30/2019.
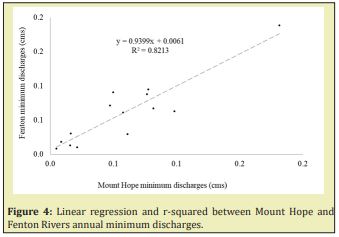
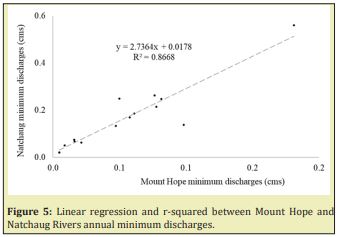
Table 3, summarize the correlation coefficients r-squared between daily discharges and annual minimum discharges between the Fenton River and the Mount Hope and Natchaug Rivers from 2006 to 2019.

Annual minimum discharges for the three river usually happen from July To October with most of the minimum are accumulated in September as shows Table 4. From Table 4, it is possible to deduce that the Fenton, Mount hope and Natchaug Rivers have most of minimum of recorded discharges in the month of September, with 8 (57% of the total), 40 (50%) and 5 (36%) events for the Fenton, Mount Hope and Natchaug respectively.
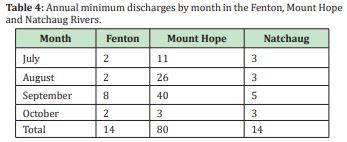
Table 4 shows that the Fenton River has a distribution of minimum discharges of: September, 14% in July, 14% in August, 57% in September and 14% in October, the Mount Hope River, 14%, 33%, 50% and 4%, the Natchaug River 21%, 21%, 36% and 21% respectively.
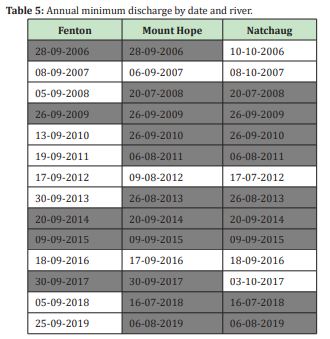
Table 5, shows the Annual minimum discharge by date in the Fenton, Mount hope and Natchaug Rivers from 2006 to 2019.
From Table 5, Mount Hope and Fenton River share the same date for an annual minimum discharge in five (5) opportunities and the Mount Hope and Natchaug Rivers in nine (9), both for 14 years of records.
Low-Fow Frequency Curves (LFFC)
LFFC Curves were built with this annual minimum, also frequency and probability of the vents was calculated, Figures 6-8.
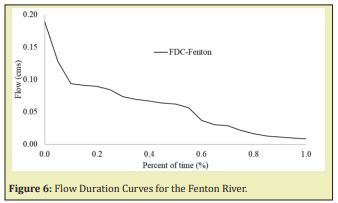
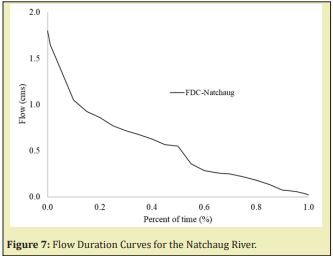
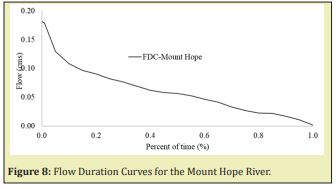
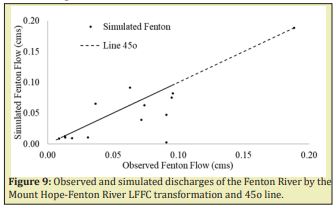
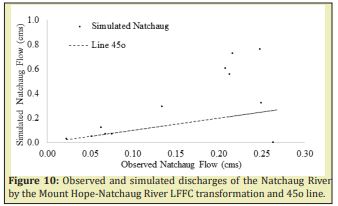
Then, for the same dates of every annual minimum calculated from 2006 to 2019 in the Fenton River, discharges were obtained from the records for the Mount Hope and Natchaug Rivers, with those discharges, the probability of exceedance of the Mount Hope and Natchaug Rivers LFFC was calculated by linear regression between probabilities. With this probability of exceedance, the simulated discharges were obtained from the LFFC of the Fenton River by linear interpolation. The results of this transformations for the Mount Hope-Fenton and Mount Hope-Natchaug Rivers are summarized in linear regression and r-square coefficient in the Figures 9&10.
Weibull distribution for minimum flows
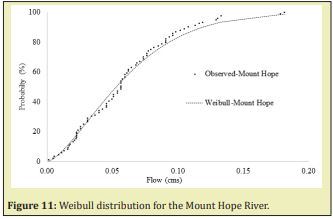
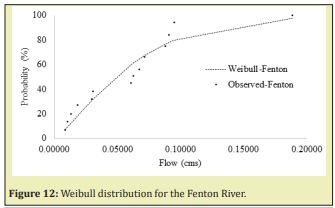
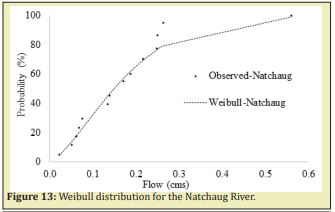
Mean, standard deviation (Std) was calculated from USGS stream flows records for the Fenton River from 07/11/2006 to 10/01/2019, Mount Hope River from 10/01/1940 to 11/01/2019 and for the Natchaug River from 10/01/1930 to 11/01//2019. A Weibull distribution was applied and the parameters Alfa and Beta were calibrated for the best fit of the Weibull distribution. Table 6 summarized the values of mean, standard deviation, Alfa and Beta parameters obtained for every watershed.

Weibull distribution curves were built with this annual minimum for the mean, standard deviation, Alfa and Beta calibrated for every watershed, Figures 11-13. For the same dates of every annual minimum discharge calculated from 2006 to 2019 in the Fenton River, discharges were obtained from the measured records for the Mount Hope and Natchaug Rivers, with those discharges, the probability of the Mount Hope and Natchaug Rivers by Weibull distribution was calculated. With this probability, the simulated discharges were obtained from the Inverse Weibull distribution of the Fenton River. The results of this transformations for the Mount Hope-Fenton and Natchaug-Fenton Rivers are summarized in linear regression in the Figures 14 &15.
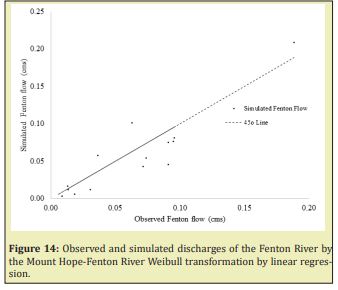
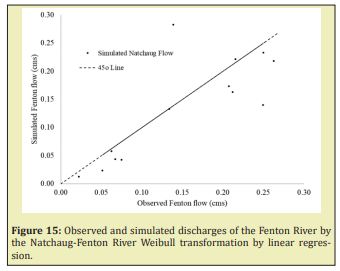
Summarizing, Table 7 shows the correlation coefficients for the observed and simulated discharges of the Fenton River applying Mount Hope-Fenton and Natchaug LFFC and Weibull distribution transformations.

The Nash - Sutcliffe model was applied to the observed and simulated discharges of the Fenton River applying Mount Hope-Fenton and Natchaug LFFC and Weibull distribution transformations. Table 8 summarize, the Nash - Sutcliffe model results.

There is a strong relationship, between the annual minimum daily discharges of the Fenton, Mount Hope and Natchaug Rivers. The correlation coefficients square-R (R2) between the Fenton-Mount Hope and Fenton-Natchaug daily discharges are 0.92 and 0.42, and for annual daily minimum discharges 0.87 and 0.67 from 07/01/2006 to 12/31/2019 respectively. Meanwhile the relationship for Fenton-Mount Hope daily and minimum discharges are very strong, for Fenton-Natchaug is weak for daily discharges meanwhile is strong for annual minimum discharges, this is due to the fact that maximum discharges in the Natchaug River are 10 times bigger than in the Fenton River.
There is an important relationship, between the annual minimum daily discharges of the Fenton, Mount Hope and Natchaug Rivers by the low-flow frequency curve transformation. The correlation coefficients square-r (R2) between the Fenton-Mount Hope and Fenton-Natchaug minimum daily discharges by LFFC transformation are 0.56 and 0.53 from 07/01/2006 to 12/31/2019 respectively. The NS coefficients by the same transformation are 0.3 and 0.5 for the Fenton-Mount Hope and Fenton-Natchaug applying LFFC transformation.
Taking in consideration that an efficiency of 1 (NSE=1) corresponds to a perfect match of modeled discharge to the observed data. An efficiency of 0 (NSE=0) indicates that the model predictions are as accurate as the mean of the observed data, whereas an efficiency less than zero (NSE<0) and a model of sufficient quality have been suggested between 0.5<NSE<0.65.
There is an important relationship, between the annual minimum daily discharges of the Fenton, Mount Hope and Natchaug Rivers by the Weibull distribution transformation. The correlation coefficients square-r (R2) between the Fenton-Mount Hope and Fenton-Natchaug minimum daily discharges by Weibull distribution transformation are 0.56 and 0.53 from 07/01/2006 to 12/31/2019 respectively.
The NS coefficients by the same transformation are 0.31 and 0.15 for the Fenton-Mount Hope and Fenton-Natchaug applying Weibull distribution transformation.
This research developed and tested two mathematical models for the prediction of minimum discharges in the Fenton and Natchaug Rivers with the discharges available from the Mount Hope River in the State of Connecticut. Low Flow Duration Curves and Weibull distribution methods were applied to the three rivers to transfer minimum discharges records from the Mount Hope River to predict minimum discharges in the Fenton and Natchaug Rivers.
The results shows that there is a stronger Daily discharges correlation between the Mount Hope-Natchaug Rivers than the Mount Hope-Fenton Rivers, 0.92 against 0.90. There is a stronger Annual daily minimum discharges correlation between the Mount Hope-Natchaug than the Mount Hope-Fenton Rivers, 0.86 against 0.82. Most of the minimum flows in the Mount Hope, Fenton and Natchaug Rivers usually occur in the month of September and in the same day for the Mount Hope and Natchaug Rivers. Correlation coefficients between the Mount Hope, Fenton and Natchaug Rivers for the LFFC Curves method for the prediction of minimum discharges were bigger for the Mount Hope-Fenton than Mount Hope-Natchaug Rivers relationships, 0.68 against 0.27. Correlation coefficients between the Mount Hope, Fenton and Natchaug Rivers for the Weibull distribution method for the prediction of minimum discharges were bigger for the Mount Hope-Fenton than Mount Hope-Natchaug Rivers relationships, 0.83 against 0.64. Nash - Sutcliffe model between the Mount Hope, Fenton and Natchaug Rivers for the LFFC Curves method for the prediction of minimum discharges was closer to 1 for the Mount Hope-Fenton than Mount Hope-Natchaug Rivers relationship, 0.57 against -13.0.
Nash - Sutcliffe model between the Mount Hope, Fenton and Natchaug Rivers for the Weibull distribution method for the prediction of minimum discharges was closer to 1 for the Mount Hope-Fenton than Mount Hope-Natchaug Rivers, 0.78 against 0.63. The results found that the meanwhile the Mount Hope-Natchaug Rivers have a much better coefficients of correlation than the Mount Hope-Fenton Rivers for measured Daily and Annual daily minimum discharges. The Low Flow Duration Curve and Weibull distribution methods shows that is much more accurate the prediction of the minimum discharges from the Mount Hope River to the Fenton River than from the Mount Hope River to the Natchaug River and that the Weibull distribution model showed a much better accuracy than the Low Flow Duration Curve method for the prediction of minimum discharges in the from the Mount Hope River to the Fenton and Natchaug Rivers.
None.
None.
Author declares that there is no conflict of interest.
- 1. Langat PK, Kumar L, Koech R. Identification of the Most Suitable Probability Distribution Models for Maximum, Minimum, and Mean Streamflow. Water. 2019;11(4):734.
- 2. Gustard A, Demuth. Manual on low-flow estimation and prediction, Operational Hydrology Report No. 50, WMO-No. 1029, World Meteorological Organization, Geneva, Switzerland. 2009.
- 3. Bloschl G. Predictions in ungauged basins–where do we stand? Proc. IAHS. 2016;373:57–60.
- 4. Rahn P. Surficial Geology of the Spring Hill Quadrangle, [Hartford] State Geological and Natural History Survey of Connecticut. 1970.
- 5. United States Army Corps of engineers (USACE). 2019.
- 6. Warner GS, Ogden FL, Bagtzoglou AC, et al. Long-Term Impact Analysis of the University of Connecticut's Fenton River Water Supply Wells on the Habitat of the Fenton River, University of Connecticut, Storrs, Connecticut. 2006. p. 211.
- 7. Giddings Jr MT. Induced Infiltration at the University of Connecticut Well Field. Master’s Thesis, 1966, University of Connecticut, Department of Geology and Hydrogeology, Storrs, Connecticut. 1966.
- 8. United states Geological Survey (USGSa). 2019.
- 9. United states Geological Survey (USGSb). 2019.
- 10. United states Geological Survey (USGSc). 2019.
- 11. Ahearn EA. Flow durations, low-flow frequencies, and monthly median flows for selected streams in Connecticut through 2005. U.S. Geological Survey Scientific Investigations Report. 2008. 2007–5270.
- 12. Environmental Protection Agency (EPA). 2019.
- 13. Searcy JK. Flow-duration curves. Manual of Hydrology: Part 2. Low-Flow Techniques, US Geol. Survey Water-Supply Paper 1542-A. USGS, Washington, DC. 1959.
- 14. Smakhtin VU. Low flow hydrology: a review. Journal of Hydrology. 2001;240:147–186.
- 15. Hughes DA, Smakhtin VY. Daily flow time series patching or extension: a spatial interpolation approach based on flow duration curves. Hydrol Sci J. 1996;41(6):851–871.
- 16. Helsel DR, Hirsch RM. Statistical Methods in Water Resources, Elsevier Science Publishers, Amsterdam. 1992.
- 17. Weibull W. The Phenomenon of Rupture in Solids: Ingeniors Vetenskaps Akademien Handlinga 153, Stockholm. 1939. p. 17.
- 18. Nash JE, Sutcliffe JV. River flow forecasting through conceptual models: Part 1 –a discussion of principles. Journal of Hydrology. 1970;10:282–290.

